

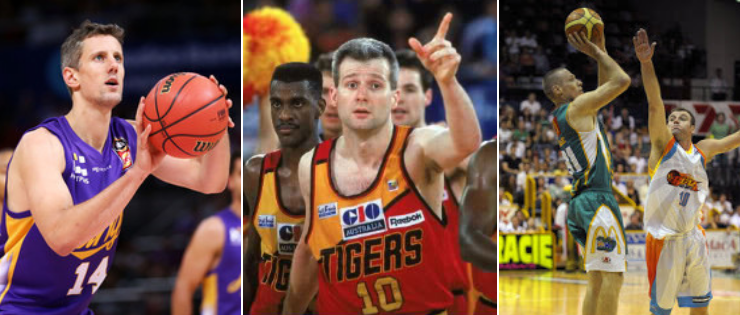
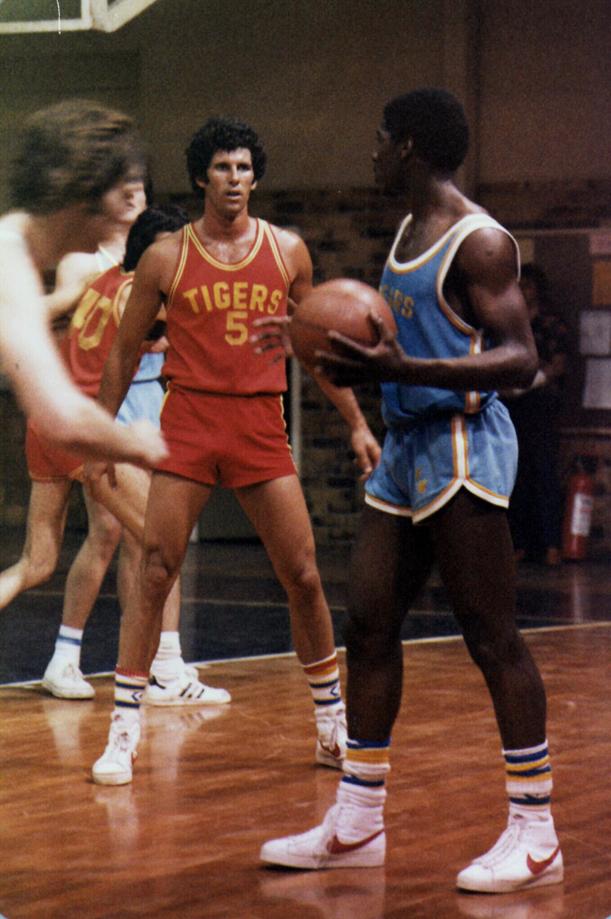
In 1984, the three-point line was introduced into the National Basketball League, with players such as Brian Goorjian, Darryl Pearce, Ron Radliff and Mark Gaze making immediate use of the long range bomb.
Since then, we’ve seen Australians like Andrew Gaze, Daniel Kickert and John Rillie master the triple, while imports like Bryce Cotton, Gary Wilkinson and Al Green have stretched opposition defences like never before.
But who are the most efficient shooters to ever get them up?
Which players have been the most efficient and devastating shooters in the 40 years of NBL history?
To determine this, we’ve used four shooting efficiency metrics: True Shooting Percentage (TS%), Effective Field Goal Percentage (eFG%), FGM Per Game and Points Per Shot.
True Shooting Percentage is a measurement of scoring efficiency that includes field goal attempts, three-point attempts and free throws.
Effective Field Goal Percentage adjusts field goal percentage to account for the fact that three-point field goals are worth three points, while regular field goals are only worth two. Its goal is to show what field goal percentage a two-point shooter would need to match the output of a player who also shoots three-pointers.
FGM Per Game shows how many field goals a player made per game, giving extra context around how much scoring volume they produced from the field.
Points Per Shot shows how many points a player scored for every field goal attempt they took. This helps show how efficiently a player turned shot attempts into points.
eFG% Formula: (FG + (0.5 x 3P)) / FGA
TS% Formula: (Points x 50) / (FGA + 0.44 x FTA)
FGM Per Game Formula: Field Goals Made / Games Played
Points Per Shot Formula: Points / Field Goal Attempts
Honourable Mentions
* Statistics only include players who have made a minimum 100 three-point shots over a career.
Marcus Timmons played 12 years in the NBL, connecting on 36% of his triples over his career (546/1515) and averaging 16 points per game.
The talented forward took his shooting ability to another level during the 1999/2000 season, when he joined the Perth Wildcats mid-year and helped lead them to an NBL title.
That season remains one of the most efficient shooting seasons in NBL history, ranking second all-time in Effective Field Goal Percentage (67.4%) and third in True Shooting Percentage (69.5%).
Most Efficient Shooting Season: 1999/00
| PPG | TS% | eFG% | FG | FG% | 3PT | 3P% | FT | FT% |
|---|---|---|---|---|---|---|---|---|
| 12.6 | 70% | 67% | 72-132 | 53% | 38-83 | 46% | 19-22 | 86% |
Career Shooting Statistics: 1996-2007
| PPG | TS% | eFG% | FG | FG% | 3PT | 3P% | FT | FT% |
|---|---|---|---|---|---|---|---|---|
| 16.2 | 54% | 51% | 1874-4196 | 45% | 546-1515 | 36% | 710-1001 | 71% |
Aaron Grabau
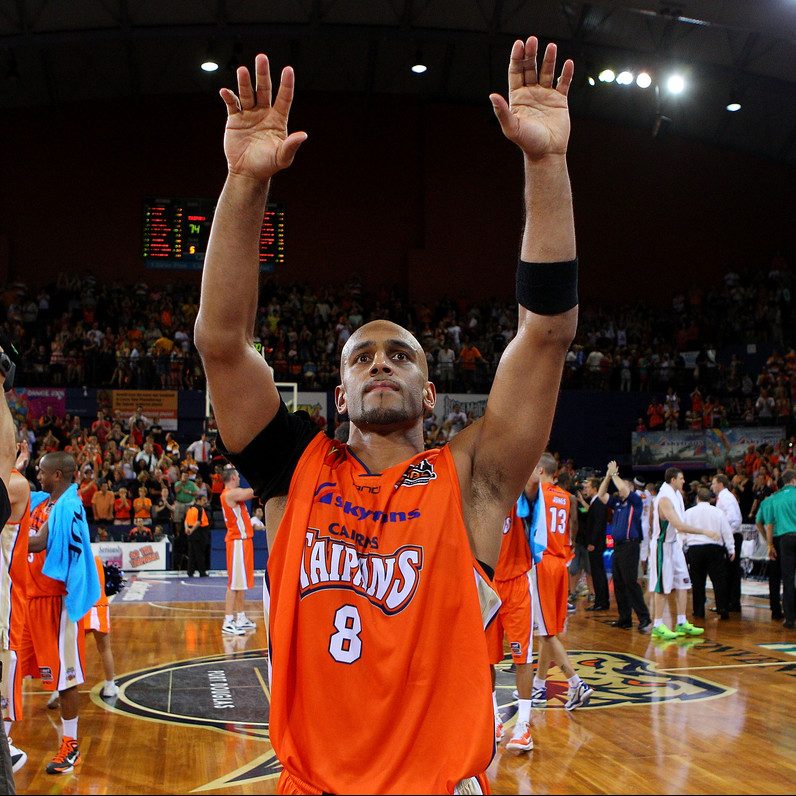
Dandenong Rangers product Aaron Grabau played 15 seasons in the NBL, including a brief stint with the Geelong Supercats in 1996 before spending the remainder of his career with the Cairns Taipans from 2000 to 2013.
The 196 cm guard wasn’t always known as a great shooter. Across the first 13 years of his career, he posted modest numbers of 41% from the field, 35% from the perimeter and 74% from the free throw line.
In his final season, however, Grabau produced one of the greatest shooting seasons of all time, finishing fourth in Effective Field Goal Percentage and sixth all-time in True Shooting Percentage.
Most Efficient Shooting Season: 2012/13
| PPG | TS% | eFG% | FG | FG% | 3PT | 3P% | FT | FT% |
|---|---|---|---|---|---|---|---|---|
| 7.3 | 69% | 50% | 55-110 | 53% | 36-68 | 53% | 23-29 | 79% |
Career Shooting Statistics: 1996-2013
| PPG | TS% | eFG% | FG | FG% | 3PT | 3P% | FT | FT% |
|---|---|---|---|---|---|---|---|---|
| 6.9 | 54% | 49% | 958-2332 | 41% | 374-1001 | 37% | 589-789 | 75% |
Chad Tucker
The all-time leader in three-point percentage, Chad Tucker played one season in the NBL with the Southern Melbourne Saints, where the 203 cm forward/centre played in a style before his time by drawing defending big men out of the key and onto the perimeter.
After hitting 55 of 106 three-pointers, he paired with fellow sharpshooters Andrew Parkinson and Simon Kerle to bring a style of perimeter play the league would not see again until beyond 2015.
Most Efficient Shooting Season: 1991
| PPG | TS% | eFG% | FG | FG% | 3PT | 3P% | FT | FT% |
|---|---|---|---|---|---|---|---|---|
| 22.6 | 59% | 56% | 192-393 | 49% | 55-106 | 52% | 81-102 | 79% |
Joe Hillman
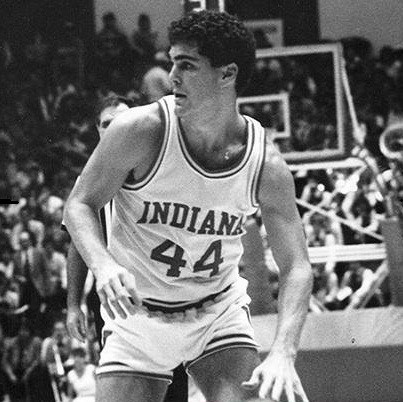
The flashy 188 cm Joe Hillman played one NBL season for the North Melbourne Giants, averaging 22.8 points while making 2.5 threes per game at a 47% clip.
Hillman, who played college ball at Indiana University from 1984 to 1989, currently ranks as the NBL’s all-time leader in Effective Field Goal Percentage (62%) and sits fourth all-time in True Shooting Percentage (62%).
Most Efficient Shooting Season: 1990
| PPG | TS% | eFG% | FG | FG% | 3PT | 3P% | FT | FT% |
|---|---|---|---|---|---|---|---|---|
| 22.8 | 62% | 62% | 265-476 | 56% | 59-125 | 47% | 72-123 | 59% |
Brian Goorjian
Brian Goorjian is regarded by many as the greatest coach in NBL history thanks to leading South East Melbourne, Sydney and the South Dragons to championships, but he was also one of the league’s original perimeter threats in 1984.
In his only NBL season as a player, Goorjian suited up for the Melbourne Tigers and launched 243 triples, around 10 per game, making 106 of them at 44% accuracy.
Although his NBL playing career lasted only one season, he ranks second all-time in both Effective Field Goal Percentage (62%) and True Shooting Percentage (63%) thanks to his one-and-done campaign with the Gaze family.
Most Efficient Shooting Season: 1984
| PPG | TS% | eFG% | FG | FG% | 3PT | 3P% | FT | FT% |
|---|---|---|---|---|---|---|---|---|
| 21.9 | 63% | 62% | 191-395 | 48% | 106-243 | 44% | 37-46 | 80% |
The Greatest Shooters In NBL History
5. Oscar Forman
After retiring in 2018, Forman walked off the court as one of the greatest shooters ever, even if many NBL fans did not fully realise it at the time. Perhaps due to playing his final years for the small program in Illawarra, or simply the no-fuss way he went about the game, Forman could shoot the ball like few others.
Oscar Forman noted on a recent Aussie Hoopla podcast that in the early years of his career, when he was shooting 22% from beyond the arc, a lot of people told him the long-range shot was not something they wanted to see from a 206 cm guy.
Fast forward to the reality that Forman’s career three-point shooting percentage of 42 percent ranks him as the most effective shooter in NBL history among players who attempted more than 800 three-pointers.
His shooting during the 2013/14 season, which ranks seventh in Effective Field Goal Percentage (63%), is also better than anyone who does not possess the last name Gaze, Smyth or Rillie, making him a certainty for the list of greatest shooters of all time.
Most Efficient Shooting Season: 2013/14
| PPG | TS% | eFG% | FG | FG% | 3PT | 3P% | FT | FT% |
|---|---|---|---|---|---|---|---|---|
| 10.7 | 64% | 64% | 113-239 | 47% | 79-170 | 46% | 16-23 | 70% |
Career Shooting Statistics: 2001-2018
| PPG | TS% | eFG% | FG | FG% | 3PT | 3P% | FT | FT% |
|---|---|---|---|---|---|---|---|---|
| 8.7 | 59% | 57% | 1609-3589 | 45% | 904-2156 | 42% | 323-447 | 72% |
4. Phil Smyth

The General owns the most effective shooting season of all time. His 1992 efforts place him first all-time in Effective Field Goal Percentage (68.0%) and second all-time in True Shooting Percentage (70.1%).
Phil Smyth was the true trail-blazer for the long-range bomb. He led the league in three-point percentage during the competition’s first year with the three-point line after connecting on 35 of 76 attempts (46%).
Smyth’s career numbers are skewed by the fact he was launching long-range bombs two years before the three-point line was introduced, meaning those shots would have been recorded as two-point attempts.
Most Efficient Shooting Season: 1992
| PPG | TS% | eFG% | FG | FG% | 3PT | 3P% | FT | FT% |
|---|---|---|---|---|---|---|---|---|
| 12.9 | 70% | 68% | 118-220 | 54% | 63-118 | 53% | 37-45 | 82% |
Career Shooting Statistics: 1982-1995
| PPG | TS% | eFG% | FG | FG% | 3PT | 3P% | FT | FT% |
|---|---|---|---|---|---|---|---|---|
| 13.9 | 57% | 53% | 1744-3895 | 45% | 627-1507 | 42% | 845-1007 | 84% |
3. John Rillie
In 2006/07, John Rillie delivered perhaps the greatest shooting season of all time. It ranks third all-time for Effective Field Goal Percentage (66.9%) and remains the greatest True Shooting season of all time (70.4%).
Playing for the Townsville Crocodiles, Rillie averaged 19.1 points per game across 35 contests. His best performance was a 37-point effort against Singapore, where he finished 11-17 from the field, 8-11 from downtown and 7-8 from the charity stripe.
Rillie’s 1998/99 season with the West Sydney Razorbacks also sits sixth in Effective Field Goal Percentage (65.2%) and eleventh in True Shooting Percentage (66.8%).
Across his career, he sits sixth all-time in both Effective Field Goal Percentage (58%) and sixth all-time in True Shooting Percentage (61%).
Most Efficient Shooting Season: 2006/07
| PPG | TS% | eFG% | FG | FG% | 3PT | 3P% | FT | FT% |
|---|---|---|---|---|---|---|---|---|
| 19.1 | 70% | 67% | 222-422 | 53% | 121-257 | 47% | 103-119 | 87% |
Career Shooting Statistics: 1995-2010
| PPG | TS% | eFG% | FG | FG% | 3PT | 3P% | FT | FT% |
|---|---|---|---|---|---|---|---|---|
| 16.3 | 61% | 58% | 2835-5996 | 47% | 1323-3321 | 40% | 868-1015 | 86% |
2. Daniel Kickert

Daniel Kickert came very close to becoming the first NBL player ever to join the exclusive 50-40-90 club in 2015/16, finishing the season with shooting splits of 52.5 percent from the field, 47.2 percent from three and 90.5 percent from the free throw line, but fell four made free throws short of the minimum requirements.
Kickert then became the first player in NBL history to officially record a 50-40-90 season in 2016/17, shooting 54.4 percent from the field, 45.9 percent from three and 95.0 percent from the line with Brisbane. He backed it up again in 2017/18, shooting 52.2 percent from the field, 41.8 percent from three and 92.2 percent from the line.
Across seven NBL seasons with Melbourne, Brisbane and Sydney, Kickert played 199 games and averaged 11.1 points, 3.5 rebounds and 1.2 assists. He finished his NBL career shooting 51.3 percent from the field, 45.3 percent from three and 88.3 percent from the free throw line.
Kickert announced his retirement from professional basketball on 11 June 2021. His career numbers left him second on this list in True Shooting Percentage (63%) and first in Effective Field Goal Percentage (60%), while also finishing with the best three-point percentage of any player in NBL history with at least 200 career makes.
Most Efficient Shooting Season: 2015/16
| PPG | TS% | eFG% | FG | FG% | 3PT | 3P% | FT | FT% |
|---|---|---|---|---|---|---|---|---|
| 13.9 | 65% | 63% | 155-297 | 54% | 61-130 | 47% | 43-48 | 90% |
Career Shooting Statistics: 2014-2019
| PPG | TS% | eFG% | FG | FG% | 3PT | 3P% | FT | FT% |
|---|---|---|---|---|---|---|---|---|
| 12.9 | 63% | 60% | 675-1307 | 52% | 211-458 | 46% | 243-276 | 88% |
1. Andrew Gaze

Always a certainty for this list, the GOAT, Andrew Gaze, played 22 seasons in the NBL. He owns two seasons which sit in the top nine for Effective Field Goal Percentage and eight of the top eighteen seasons for True Shooting Percentage.
Funnily enough, Gaze was not a master from the three-point line when he entered the league. In 1984, his rookie season, he connected on just 13 of 40 three-point shots, but still finished his career as the league’s all-time leader in True Shooting Percentage (65%) and second in Effective Field Goal Percentage (59%).
While Daniel Kickert’s shooting percentages are incredible, Gaze gets the nod for first place due to the sheer volume of shots he made, the length of time he maintained that efficiency, and the number of years he was recognised as the league’s most efficient scorer.
The NBL introduced the Most Efficient Player award in 1990, only to abandon it in 1997 after Gaze won it every single year it existed. That level of sustained efficiency, across a career where he was also carrying one of the league’s heaviest scoring loads, is why Gaze sits at number one.
Most Efficient Shooting Season: 1990
| PPG | TS% | eFG% | FG | FG% | 3PT | 3P% | FT | FT% |
|---|---|---|---|---|---|---|---|---|
| 37.6 | 69% | 65% | 300-522 | 53% | 77-200 | 39% | 151-153 | 99% |
Career Shooting Statistics: 1984-2005
| PPG | TS% | eFG% | FG | FG% | 3PT | 3P% | FT | FT% |
|---|---|---|---|---|---|---|---|---|
| 30.9 | 65% | 59% | 6484-12529 | 52% | 1826-5005 | 36% | 4114-4783 | 86% |
All-Time Shooting Statistics
Player must have made 50+ threes over their career.
| Player | GMS | PPG | TS% | eFG% | FGM-FGA | FG% | 3PM-3PA | 3P% | FTM-FTA | FT% | FGM P/GM | PTS P/Shot |
|---|---|---|---|---|---|---|---|---|---|---|---|---|
| Andrew Gaze | 612 | 30.9 | 65% | 59% | 6484-12529 | 52% | 1826-5005 | 36% | 4114-4783 | 86% | 10.6 | 1.5 |
| Daniel Kickert | 199 | 11.1 | 64% | 60% | 818-1594 | 51% | 280-618 | 45% | 302-342 | 88% | 4.1 | 1.4 |
| Nicholas Kay | 154 | 12.6 | 61% | 57% | 753-1399 | 54% | 102-253 | 40% | 325-412 | 79% | 4.9 | 1.4 |
| Dylan Windler | 56 | 12.5 | 61% | 58% | 248-518 | 48% | 104-268 | 39% | 101-127 | 80% | 4.4 | 1.4 |
| Gary Wilkinson | 89 | 16.0 | 61% | 57% | 538-1043 | 52% | 121-323 | 37% | 226-280 | 81% | 6.0 | 1.4 |
| John Rillie | 481 | 16.3 | 61% | 58% | 2835-5996 | 47% | 1323-3321 | 40% | 868-1015 | 86% | 5.9 | 1.3 |
| Brad Davidson | 393 | 8.6 | 61% | 55% | 1032-2407 | 43% | 607-1515 | 40% | 722-863 | 84% | 2.6 | 1.4 |
| Robert Franks | 55 | 17.9 | 61% | 57% | 360-722 | 50% | 110-290 | 38% | 157-204 | 77% | 6.5 | 1.4 |
| Patric Fairs | 52 | 25.2 | 61% | 58% | 501-1004 | 50% | 167-416 | 40% | 143-182 | 79% | 9.6 | 1.3 |
| Kendric Davis | 67 | 25.3 | 60% | 55% | 566-1186 | 48% | 165-450 | 37% | 397-489 | 81% | 8.4 | 1.4 |
| Everette Stephens | 77 | 21.8 | 60% | 55% | 593-1199 | 49% | 127-322 | 39% | 364-445 | 82% | 7.7 | 1.4 |
| Jack McVeigh | 215 | 12.6 | 60% | 56% | 995-2054 | 48% | 327-845 | 39% | 389-457 | 85% | 4.6 | 1.3 |
| Andre LaFleur | 150 | 21.0 | 60% | 56% | 1117-2287 | 49% | 306-771 | 40% | 612-781 | 78% | 7.4 | 1.4 |
| Stephen Black | 298 | 13.7 | 60% | 54% | 1357-3008 | 45% | 548-1336 | 41% | 782-910 | 86% | 4.6 | 1.4 |
| Cameron Gliddon | 339 | 9.2 | 60% | 56% | 1035-2397 | 43% | 630-1639 | 38% | 417-486 | 86% | 3.1 | 1.3 |
| Jason Smith | 408 | 12.9 | 60% | 57% | 1839-3994 | 46% | 869-2151 | 40% | 723-967 | 75% | 4.5 | 1.3 |
| Al Green | 340 | 22.1 | 60% | 56% | 2899-5463 | 53% | 275-756 | 36% | 1446-1933 | 75% | 8.5 | 1.4 |
| Kirk Penney | 187 | 20.2 | 60% | 55% | 1248-2778 | 45% | 578-1392 | 42% | 702-895 | 78% | 6.7 | 1.4 |
| Ricky Grace | 482 | 18.3 | 60% | 55% | 3083-6500 | 47% | 960-2381 | 40% | 1676-2033 | 82% | 6.4 | 1.4 |
| Bj Carter | 150 | 4.2 | 59% | 58% | 211-497 | 42% | 152-350 | 43% | 51-65 | 78% | 1.4 | 1.3 |
| Jarell Martin | 79 | 14.6 | 59% | 56% | 437-876 | 50% | 100-265 | 38% | 181-227 | 80% | 5.5 | 1.3 |
| Todd Lichti | 82 | 16.8 | 59% | 55% | 521-1046 | 50% | 114-282 | 40% | 220-266 | 83% | 6.4 | 1.3 |
| Majok Deng | 279 | 9.4 | 59% | 53% | 878-1894 | 46% | 265-757 | 35% | 594-722 | 82% | 3.1 | 1.4 |
| Derek Rucker | 411 | 22.8 | 59% | 54% | 3138-6915 | 45% | 1169-3124 | 37% | 1934-2338 | 83% | 7.6 | 1.4 |
| Cameron Oliver | 84 | 15.5 | 59% | 57% | 511-1006 | 51% | 118-353 | 33% | 164-224 | 73% | 6.1 | 1.3 |
| Andrew Parkinson | 265 | 10.7 | 59% | 53% | 897-2058 | 44% | 394-1072 | 37% | 645-779 | 83% | 3.4 | 1.4 |
| Butch Hays | 232 | 18.6 | 59% | 53% | 1522-3100 | 49% | 260-663 | 39% | 1009-1278 | 79% | 6.6 | 1.4 |
| Oscar Forman | 508 | 8.7 | 59% | 58% | 1604-3570 | 45% | 901-2142 | 42% | 322-444 | 73% | 3.2 | 1.2 |
| CJ Bruton | 516 | 14.9 | 59% | 54% | 2433-5701 | 43% | 1261-3128 | 40% | 1547-1867 | 83% | 4.7 | 1.3 |
| Mitchell Creek | 338 | 14.0 | 59% | 54% | 1732-3419 | 51% | 251-714 | 35% | 1033-1410 | 73% | 5.1 | 1.4 |
| Rotnei Clarke | 86 | 18.8 | 59% | 54% | 560-1244 | 45% | 232-612 | 38% | 264-302 | 87% | 6.5 | 1.3 |
| Scott Fisher | 417 | 22.1 | 58% | 53% | 3580-6933 | 52% | 247-640 | 39% | 1818-2167 | 84% | 8.6 | 1.3 |
| David Barlow | 388 | 8.3 | 58% | 56% | 1101-2485 | 44% | 560-1336 | 42% | 445-597 | 75% | 2.8 | 1.3 |
| Peter Hill | 202 | 10.2 | 58% | 55% | 678-1592 | 43% | 383-925 | 41% | 318-391 | 81% | 3.4 | 1.3 |
| Melo Trimble | 58 | 20.8 | 58% | 53% | 398-888 | 45% | 137-355 | 39% | 275-338 | 81% | 6.9 | 1.4 |
| Angus Glover | 184 | 7.2 | 58% | 56% | 465-1048 | 44% | 247-681 | 36% | 144-202 | 71% | 2.5 | 1.3 |
| Martin Cattalini | 453 | 14.4 | 58% | 54% | 2405-4925 | 49% | 507-1286 | 39% | 1195-1559 | 77% | 5.3 | 1.3 |
| Adam Ballinger | 340 | 15.2 | 58% | 56% | 2118-4140 | 51% | 364-972 | 37% | 578-731 | 79% | 6.2 | 1.3 |
| Robert Loe | 238 | 6.8 | 58% | 56% | 616-1259 | 49% | 182-531 | 34% | 214-327 | 65% | 2.6 | 1.3 |
| Terry Johnson | 200 | 11.4 | 58% | 54% | 828-1787 | 46% | 289-753 | 38% | 344-424 | 81% | 4.1 | 1.3 |
| Jaylin Galloway | 124 | 6.8 | 58% | 55% | 299-637 | 47% | 109-320 | 34% | 130-193 | 67% | 2.4 | 1.3 |
| Ian Clark | 102 | 13.3 | 58% | 55% | 511-1101 | 46% | 194-512 | 38% | 140-158 | 89% | 5.0 | 1.2 |
| Pat Reidy | 467 | 16.9 | 58% | 54% | 3108-6096 | 51% | 427-1212 | 35% | 1242-1615 | 77% | 6.7 | 1.3 |
| Pero Cameron | 130 | 8.7 | 58% | 55% | 394-869 | 45% | 164-433 | 38% | 174-235 | 74% | 3.0 | 1.3 |
| Bryce Cotton | 294 | 23.4 | 58% | 51% | 2184-5137 | 43% | 884-2377 | 37% | 1626-1835 | 89% | 7.4 | 1.3 |
| Kent Lockhart | 81 | 24.3 | 58% | 55% | 795-1581 | 50% | 161-424 | 38% | 220-291 | 76% | 9.8 | 1.2 |
| James Harvey | 349 | 15.4 | 58% | 54% | 1853-4153 | 45% | 740-1859 | 40% | 924-1151 | 80% | 5.3 | 1.3 |
| Joe Ingles | 102 | 14.5 | 58% | 53% | 499-1101 | 45% | 169-472 | 36% | 309-413 | 75% | 4.9 | 1.3 |
| Isaac Burton | 96 | 21.3 | 57% | 53% | 733-1543 | 48% | 162-430 | 38% | 420-541 | 78% | 7.6 | 1.3 |
| Shawn Redhage | 391 | 14.8 | 57% | 53% | 2114-4337 | 49% | 371-1006 | 37% | 1261-1628 | 77% | 5.4 | 1.3 |
| Harry Froling | 169 | 6.1 | 57% | 53% | 347-758 | 46% | 113-291 | 39% | 228-325 | 70% | 2.1 | 1.4 |
| Peter Crawford | 488 | 10.8 | 57% | 54% | 1772-4076 | 43% | 844-2232 | 38% | 879-1158 | 76% | 3.6 | 1.3 |
| David Close | 219 | 9.9 | 57% | 57% | 796-1828 | 44% | 493-1209 | 41% | 78-127 | 61% | 3.6 | 1.2 |
| Flynn Cameron | 102 | 7.4 | 57% | 53% | 254-592 | 43% | 125-327 | 38% | 126-157 | 80% | 2.5 | 1.3 |
| Finn Delany | 215 | 9.5 | 57% | 53% | 720-1564 | 46% | 216-647 | 33% | 389-499 | 78% | 3.3 | 1.3 |
| Leroy Loggins | 567 | 23.1 | 57% | 54% | 5249-10402 | 50% | 652-1655 | 39% | 1956-2384 | 82% | 9.3 | 1.3 |
| Phil Smyth | 356 | 13.9 | 57% | 53% | 1744-3895 | 45% | 627-1507 | 42% | 845-1007 | 84% | 4.9 | 1.3 |
| Mick Corkeron | 128 | 8.2 | 57% | 55% | 372-850 | 44% | 192-455 | 42% | 111-153 | 73% | 2.9 | 1.2 |
| Tonny Jensen | 209 | 14.8 | 57% | 52% | 1056-2364 | 45% | 344-910 | 38% | 646-810 | 80% | 5.1 | 1.3 |
| Daniel Johnson | 415 | 14.7 | 57% | 50% | 2070-4458 | 46% | 326-932 | 35% | 1649-2060 | 80% | 5.0 | 1.4 |
| Dj Newbill | 86 | 15.6 | 57% | 53% | 479-1046 | 46% | 158-420 | 38% | 228-313 | 73% | 5.6 | 1.3 |
| Tim Coenraad | 371 | 7.5 | 57% | 53% | 954-2196 | 43% | 424-1106 | 38% | 434-546 | 79% | 2.6 | 1.3 |
| Chris Goulding | 499 | 14.5 | 57% | 53% | 2400-5800 | 41% | 1347-3607 | 37% | 1087-1313 | 83% | 4.8 | 1.2 |
| Shane Heal | 440 | 20.6 | 57% | 52% | 3071-7286 | 42% | 1502-3929 | 38% | 1321-1607 | 82% | 7.0 | 1.2 |
| Kevin Lisch | 233 | 14.8 | 57% | 52% | 1130-2668 | 42% | 490-1306 | 38% | 704-863 | 82% | 4.8 | 1.3 |
| Darryl Pearce | 374 | 15.6 | 57% | 55% | 2206-4875 | 45% | 908-2166 | 42% | 522-655 | 80% | 5.9 | 1.2 |
| Darren Ng | 192 | 7.6 | 57% | 54% | 502-1172 | 43% | 251-639 | 39% | 201-261 | 77% | 2.6 | 1.2 |
| Jerome Randle | 126 | 20.3 | 57% | 52% | 950-2033 | 47% | 203-574 | 35% | 452-512 | 88% | 7.5 | 1.3 |
| Andrew Vlahov | 349 | 16.2 | 57% | 52% | 2034-4238 | 48% | 324-884 | 37% | 1273-1748 | 73% | 5.8 | 1.3 |
| Bul Kuol | 132 | 9.5 | 57% | 53% | 421-1001 | 42% | 224-605 | 37% | 184-239 | 77% | 3.2 | 1.2 |
| David Colbert | 144 | 23.9 | 56% | 53% | 1305-2782 | 47% | 340-878 | 39% | 487-592 | 82% | 9.1 | 1.2 |
| Kyrin Galloway | 158 | 4.8 | 56% | 54% | 276-620 | 45% | 119-347 | 34% | 86-114 | 75% | 1.7 | 1.2 |
| Stephen Hoare | 465 | 8.1 | 56% | 53% | 1478-2970 | 50% | 206-635 | 32% | 553-803 | 69% | 3.2 | 1.3 |
| Darnell Hinson | 61 | 17.1 | 56% | 51% | 321-782 | 41% | 150-430 | 35% | 250-321 | 78% | 5.3 | 1.3 |
| Kevin Brooks | 158 | 18.0 | 56% | 53% | 1011-2304 | 44% | 407-1045 | 39% | 419-504 | 83% | 6.4 | 1.2 |
| Ebi Ere | 176 | 19.1 | 56% | 53% | 1199-2664 | 45% | 433-1158 | 37% | 525-712 | 74% | 6.8 | 1.3 |
| Ron Radliff | 263 | 14.3 | 56% | 54% | 1377-3143 | 44% | 639-1468 | 44% | 366-440 | 83% | 5.2 | 1.2 |
| Adonis Jordan | 76 | 19.8 | 56% | 53% | 533-1222 | 44% | 237-587 | 40% | 203-261 | 78% | 7.0 | 1.2 |
| Stephen Whitehead | 291 | 9.8 | 56% | 53% | 1077-2268 | 47% | 272-814 | 33% | 413-576 | 72% | 3.7 | 1.3 |
| Frank Drmic | 255 | 11.7 | 56% | 53% | 1063-2361 | 45% | 395-1051 | 38% | 451-640 | 70% | 4.2 | 1.3 |
| Kelvin Robertson | 243 | 7.8 | 56% | 53% | 634-1505 | 42% | 314-897 | 35% | 317-419 | 76% | 2.6 | 1.3 |
| Ron Lemons | 149 | 16.8 | 56% | 54% | 1057-2108 | 50% | 170-385 | 44% | 223-278 | 80% | 7.1 | 1.2 |
| Cameron Rigby | 193 | 7.9 | 56% | 53% | 543-1219 | 45% | 198-503 | 39% | 237-313 | 76% | 2.8 | 1.2 |
| Brad Newley | 323 | 11.9 | 56% | 53% | 1373-3020 | 45% | 430-1231 | 35% | 666-928 | 72% | 4.3 | 1.3 |
| Steve Woodberry | 143 | 24.2 | 56% | 52% | 1321-2798 | 47% | 249-629 | 40% | 565-654 | 86% | 9.2 | 1.2 |
| Stephen Holt | 69 | 11.8 | 56% | 51% | 259-631 | 41% | 122-324 | 38% | 173-216 | 80% | 3.8 | 1.3 |
| Thomas Abercrombie | 426 | 10.4 | 56% | 52% | 1530-3471 | 44% | 568-1464 | 39% | 788-1078 | 73% | 3.6 | 1.3 |
| Chris Anstey | 336 | 15.5 | 56% | 51% | 1825-3900 | 47% | 290-957 | 30% | 1257-1689 | 74% | 5.4 | 1.3 |
| Jaylen Adams | 92 | 18.4 | 56% | 50% | 551-1289 | 43% | 181-508 | 36% | 410-511 | 80% | 6.0 | 1.3 |
| Kouat Noi | 181 | 10.1 | 56% | 51% | 622-1454 | 43% | 247-704 | 35% | 344-426 | 81% | 3.4 | 1.3 |
| Darryl McDonald | 486 | 13.0 | 56% | 52% | 2385-4893 | 49% | 350-1190 | 29% | 1188-1711 | 69% | 4.9 | 1.3 |
| Ricky Jones | 52 | 27.7 | 56% | 53% | 544-1140 | 48% | 109-285 | 38% | 243-340 | 71% | 10.5 | 1.3 |
| Mat Campbell | 524 | 11.7 | 56% | 52% | 2075-4969 | 42% | 1049-2609 | 40% | 956-1242 | 77% | 4.0 | 1.2 |
| Todd Blanchfield | 463 | 8.8 | 56% | 52% | 1406-3313 | 42% | 632-1850 | 34% | 634-785 | 81% | 3.0 | 1.2 |
| Brad Sheridan | 306 | 6.4 | 56% | 54% | 696-1602 | 43% | 347-963 | 36% | 233-380 | 61% | 2.3 | 1.2 |
| Charles Thomas | 136 | 16.2 | 56% | 52% | 768-1814 | 42% | 367-1007 | 36% | 304-386 | 79% | 5.6 | 1.2 |
| Trey Kell III | 74 | 15.8 | 56% | 48% | 360-882 | 41% | 128-382 | 34% | 324-390 | 83% | 4.9 | 1.3 |
| Phill Jones | 157 | 12.1 | 56% | 51% | 648-1539 | 42% | 278-692 | 40% | 328-389 | 84% | 4.1 | 1.2 |
| Michael Johnson | 364 | 20.9 | 56% | 53% | 2997-6370 | 47% | 778-1944 | 40% | 832-1062 | 78% | 8.2 | 1.2 |
| Andrew Goodwin | 431 | 11.7 | 56% | 52% | 1992-4010 | 50% | 171-506 | 34% | 888-1199 | 74% | 4.6 | 1.3 |
| Gary Boodnikoff | 253 | 9.5 | 56% | 53% | 840-1983 | 42% | 423-1135 | 37% | 305-422 | 72% | 3.3 | 1.2 |
| Daryl Corletto | 397 | 8.3 | 55% | 53% | 1201-2767 | 43% | 515-1404 | 37% | 360-423 | 85% | 3.0 | 1.2 |
| Casey Prather | 133 | 17.9 | 55% | 50% | 848-1870 | 45% | 190-529 | 36% | 497-632 | 79% | 6.4 | 1.3 |
| Steven Markovic | 135 | 10.0 | 55% | 52% | 473-1096 | 43% | 185-498 | 37% | 221-279 | 79% | 3.5 | 1.2 |
| Paul Stanley | 69 | 32.6 | 55% | 53% | 938-1896 | 49% | 124-271 | 46% | 248-297 | 84% | 13.6 | 1.2 |
| Mike Kelly | 346 | 12.5 | 55% | 52% | 1506-3526 | 43% | 650-1731 | 38% | 660-848 | 78% | 4.4 | 1.2 |
| Jesse Wagstaff | 533 | 7.5 | 55% | 49% | 1283-3130 | 41% | 517-1482 | 35% | 933-1125 | 83% | 2.4 | 1.3 |
| Parker Jackson-Cartwright | 85 | 19.0 | 55% | 51% | 601-1289 | 47% | 121-369 | 33% | 294-390 | 75% | 7.1 | 1.3 |
| Robert Rose | 477 | 19.0 | 55% | 50% | 3115-7174 | 43% | 884-2603 | 34% | 1966-2361 | 83% | 6.5 | 1.3 |
| Kavossy Franklin | 164 | 19.3 | 55% | 51% | 1153-2531 | 46% | 291-777 | 37% | 571-772 | 74% | 7.0 | 1.3 |
| Mark Davis | 481 | 18.2 | 55% | 50% | 3235-6664 | 49% | 245-791 | 31% | 2037-2888 | 71% | 6.7 | 1.3 |
| Jason Cameron | 207 | 6.5 | 55% | 54% | 486-1119 | 43% | 228-642 | 36% | 152-244 | 62% | 2.3 | 1.2 |
| Nathan Sobey | 325 | 15.7 | 55% | 49% | 1712-4063 | 42% | 580-1745 | 33% | 1114-1327 | 84% | 5.3 | 1.3 |
| Dave Thomas | 232 | 14.6 | 55% | 52% | 1360-2817 | 48% | 197-589 | 33% | 480-614 | 78% | 5.9 | 1.2 |
| Brad Williamson | 192 | 7.0 | 55% | 51% | 429-1093 | 39% | 259-682 | 38% | 218-274 | 80% | 2.2 | 1.2 |
| Adam Gibson | 460 | 9.0 | 55% | 52% | 1530-3468 | 44% | 528-1480 | 36% | 571-714 | 80% | 3.3 | 1.2 |
| Sean MacDonald | 86 | 7.0 | 55% | 54% | 227-522 | 43% | 109-266 | 41% | 39-60 | 65% | 2.6 | 1.2 |
| Tad Dufelmeier | 179 | 12.5 | 55% | 51% | 887-1859 | 48% | 120-315 | 38% | 350-423 | 83% | 5.0 | 1.2 |
| Russell Hinder | 349 | 8.7 | 55% | 52% | 1086-2409 | 45% | 310-780 | 40% | 592-807 | 73% | 3.1 | 1.3 |
| Larry Davidson | 319 | 7.4 | 55% | 51% | 888-1889 | 47% | 157-480 | 33% | 414-572 | 72% | 2.8 | 1.2 |
| Torrey Craig | 103 | 11.8 | 55% | 53% | 459-999 | 46% | 131-368 | 36% | 170-257 | 66% | 4.5 | 1.2 |
| Scott Ninnis | 318 | 9.2 | 55% | 51% | 1104-2330 | 47% | 179-524 | 34% | 554-811 | 68% | 3.5 | 1.3 |
| Mike Mitchell | 176 | 22.0 | 55% | 50% | 1445-3029 | 48% | 126-416 | 30% | 861-1176 | 73% | 8.2 | 1.3 |
| Dejan Vasiljevic | 176 | 14.3 | 55% | 50% | 844-2101 | 40% | 423-1172 | 36% | 408-464 | 88% | 4.8 | 1.2 |
| Sam Mackinnon | 459 | 14.1 | 55% | 53% | 2658-5270 | 50% | 254-775 | 33% | 854-1513 | 56% | 5.8 | 1.2 |
| Wani Swaka Lo Buluk | 205 | 5.0 | 55% | 52% | 393-876 | 45% | 132-385 | 34% | 117-165 | 71% | 1.9 | 1.2 |
| Anthony Drmic | 276 | 8.1 | 55% | 52% | 801-1846 | 43% | 306-919 | 33% | 338-485 | 70% | 2.9 | 1.2 |
| Anthony Stewart | 489 | 12.9 | 54% | 51% | 2137-5282 | 40% | 1164-3224 | 36% | 866-1151 | 75% | 4.4 | 1.2 |
| Lucas Walker | 240 | 6.0 | 54% | 51% | 540-1156 | 47% | 101-334 | 30% | 270-407 | 66% | 2.3 | 1.3 |
| Steve Carfino | 132 | 23.4 | 54% | 51% | 1200-2610 | 46% | 275-706 | 39% | 414-528 | 78% | 9.1 | 1.2 |
| Tyler Harvey | 185 | 17.5 | 54% | 51% | 1150-2764 | 42% | 521-1428 | 36% | 419-495 | 85% | 6.2 | 1.2 |
| Ron Dorsey | 61 | 12.1 | 54% | 53% | 273-632 | 43% | 122-349 | 35% | 72-112 | 64% | 4.5 | 1.2 |
| Aaron Olson | 130 | 13.8 | 54% | 51% | 621-1520 | 41% | 298-817 | 36% | 260-312 | 83% | 4.8 | 1.2 |
| Randy Rutherford | 111 | 21.5 | 54% | 51% | 866-2016 | 43% | 343-925 | 37% | 315-426 | 74% | 7.8 | 1.2 |
| Jamie Kennedy | 264 | 12.1 | 54% | 51% | 1199-2723 | 44% | 377-965 | 39% | 415-496 | 84% | 4.5 | 1.2 |
| Jim Bateman | 236 | 17.1 | 54% | 50% | 1607-3305 | 49% | 124-349 | 36% | 693-945 | 73% | 6.8 | 1.2 |
| David Graham | 268 | 13.3 | 54% | 51% | 1366-3010 | 45% | 358-904 | 40% | 477-643 | 74% | 5.1 | 1.2 |
| Jarrad Weeks | 280 | 5.1 | 54% | 51% | 473-1183 | 40% | 254-710 | 36% | 230-312 | 74% | 1.7 | 1.2 |
| Paul Maley | 270 | 17.6 | 54% | 51% | 1842-4007 | 46% | 418-1038 | 40% | 645-860 | 75% | 6.8 | 1.2 |
| Scott McGregor | 413 | 10.9 | 54% | 52% | 1696-3727 | 46% | 500-1436 | 35% | 679-960 | 71% | 4.1 | 1.2 |
| Mojave King | 95 | 7.1 | 54% | 51% | 238-573 | 42% | 113-322 | 35% | 85-114 | 75% | 2.5 | 1.2 |
| Ben Ayre | 117 | 6.8 | 54% | 49% | 256-655 | 39% | 127-354 | 36% | 156-182 | 86% | 2.2 | 1.2 |
| Clayton Ritter | 116 | 20.5 | 54% | 50% | 939-1991 | 47% | 124-380 | 33% | 381-484 | 79% | 8.1 | 1.2 |
| Mark Worthington | 334 | 14.2 | 54% | 48% | 1590-3711 | 43% | 381-1192 | 32% | 1198-1575 | 76% | 4.8 | 1.3 |
| Elijah Pepper | 66 | 9.1 | 54% | 51% | 208-515 | 40% | 108-325 | 33% | 75-90 | 83% | 3.2 | 1.2 |
| Mark Leader | 327 | 12.2 | 54% | 51% | 1561-3282 | 48% | 227-655 | 35% | 653-964 | 68% | 4.8 | 1.2 |
| Simon Dwight | 314 | 14.9 | 54% | 51% | 1833-3908 | 47% | 293-824 | 36% | 721-969 | 74% | 5.8 | 1.2 |
| Nathan Crosswell | 350 | 8.8 | 54% | 48% | 1076-2378 | 45% | 151-519 | 29% | 770-1065 | 72% | 3.1 | 1.3 |
| Marcus Timmons | 308 | 16.2 | 54% | 51% | 1874-4196 | 45% | 546-1515 | 36% | 710-1001 | 71% | 6.1 | 1.2 |
| Axel Dench | 187 | 9.4 | 54% | 52% | 671-1495 | 45% | 200-491 | 41% | 211-295 | 72% | 3.6 | 1.2 |
| Cal Bruton | 250 | 19.3 | 54% | 50% | 1864-4098 | 45% | 373-958 | 39% | 727-871 | 83% | 7.5 | 1.2 |
| Clint Steindl | 354 | 6.9 | 54% | 51% | 842-2152 | 39% | 512-1353 | 38% | 262-296 | 89% | 2.4 | 1.1 |
| Brett Maher | 525 | 16.1 | 54% | 53% | 3140-7072 | 44% | 1162-2835 | 41% | 1499-1764 | 85% | 6.0 | 1.2 |
| Greg Hubbard | 253 | 14.9 | 54% | 51% | 1440-3288 | 44% | 497-1325 | 38% | 395-492 | 80% | 5.7 | 1.1 |
| Jerry Everett | 85 | 28.7 | 54% | 51% | 984-2064 | 48% | 133-448 | 30% | 335-456 | 73% | 11.6 | 1.2 |
| Aaron Grabau | 418 | 6.9 | 54% | 49% | 958-2332 | 41% | 374-1001 | 37% | 589-789 | 75% | 2.3 | 1.2 |
| Mark Nash | 313 | 7.7 | 54% | 52% | 965-2056 | 47% | 224-699 | 32% | 258-434 | 59% | 3.1 | 1.2 |
| Jason Cadee | 417 | 8.5 | 54% | 49% | 1153-2936 | 39% | 596-1726 | 35% | 633-819 | 77% | 2.8 | 1.2 |
| Vince Hinchen | 188 | 21.5 | 54% | 49% | 1574-3358 | 47% | 168-441 | 38% | 723-930 | 78% | 8.4 | 1.2 |
| Darnell Mee | 362 | 14.2 | 54% | 48% | 1736-4104 | 42% | 490-1560 | 31% | 1161-1539 | 75% | 4.8 | 1.2 |
| Justin Withers | 222 | 12.8 | 54% | 51% | 1122-2388 | 47% | 179-537 | 33% | 421-609 | 69% | 5.1 | 1.2 |
| Mike Helms | 95 | 21.8 | 53% | 49% | 721-1676 | 43% | 202-576 | 35% | 431-607 | 71% | 7.6 | 1.2 |
| Cameron Dickinson | 207 | 10.6 | 53% | 50% | 791-1891 | 42% | 317-920 | 34% | 302-392 | 77% | 3.8 | 1.2 |
| Mitchell Norton | 390 | 7.3 | 53% | 46% | 916-2228 | 41% | 234-743 | 31% | 780-1004 | 78% | 2.3 | 1.3 |
| Mitchell McCarron | 268 | 8.2 | 53% | 48% | 781-1824 | 43% | 200-616 | 32% | 423-514 | 82% | 2.9 | 1.2 |
| Justinian Jessup | 70 | 13.1 | 53% | 51% | 354-822 | 43% | 138-396 | 35% | 73-92 | 79% | 5.1 | 1.1 |
| Damon Lowery | 185 | 10.5 | 53% | 46% | 597-1528 | 39% | 203-662 | 31% | 550-686 | 80% | 3.2 | 1.3 |
| Cortez Groves | 164 | 18.5 | 53% | 49% | 1049-2514 | 42% | 388-1150 | 34% | 543-758 | 72% | 6.4 | 1.2 |
| Rhys Martin | 267 | 7.2 | 53% | 49% | 679-1591 | 43% | 196-586 | 33% | 356-465 | 77% | 2.5 | 1.2 |
| Daniel Egan | 417 | 6.9 | 53% | 52% | 1223-2472 | 49% | 111-315 | 35% | 326-542 | 60% | 2.9 | 1.2 |
| Ben Madgen | 167 | 14.1 | 53% | 49% | 844-1975 | 43% | 230-666 | 35% | 433-535 | 81% | 5.1 | 1.2 |
| Mike Ellis | 302 | 12.6 | 53% | 49% | 1392-3206 | 43% | 370-979 | 38% | 648-844 | 77% | 4.6 | 1.2 |
| Lanard Copeland | 532 | 20.2 | 53% | 50% | 4078-9373 | 44% | 1242-3569 | 35% | 1337-1664 | 80% | 7.7 | 1.1 |
| Adris De León | 67 | 15.3 | 53% | 47% | 341-837 | 41% | 112-325 | 34% | 230-293 | 78% | 5.1 | 1.2 |
| Mike Chappell | 103 | 18.1 | 53% | 50% | 654-1545 | 42% | 225-608 | 37% | 329-482 | 68% | 6.3 | 1.2 |
| Alex Loughton | 309 | 10.8 | 53% | 49% | 1228-2835 | 43% | 315-883 | 36% | 561-708 | 79% | 4.0 | 1.2 |
| Scott Fenton | 139 | 7.1 | 53% | 49% | 363-855 | 42% | 118-306 | 39% | 142-173 | 82% | 2.6 | 1.2 |
| William McDowell-White | 91 | 9.0 | 53% | 51% | 315-733 | 43% | 111-345 | 32% | 78-92 | 85% | 3.5 | 1.1 |
| Jermaine Beal | 119 | 14.9 | 53% | 48% | 569-1487 | 38% | 279-758 | 37% | 362-440 | 82% | 4.8 | 1.2 |
| Tanner Krebs | 168 | 5.9 | 53% | 50% | 361-877 | 41% | 162-464 | 35% | 106-133 | 80% | 2.1 | 1.1 |
| Rob Feaster | 84 | 19.1 | 53% | 49% | 591-1322 | 45% | 112-320 | 35% | 307-434 | 71% | 7.0 | 1.2 |
| Shea Ili | 282 | 7.6 | 53% | 47% | 708-1721 | 41% | 203-613 | 33% | 529-703 | 75% | 2.5 | 1.2 |
| Jamie Pearlman | 233 | 7.2 | 53% | 49% | 577-1392 | 41% | 210-619 | 34% | 304-424 | 72% | 2.5 | 1.2 |
| Terrico White | 60 | 16.0 | 53% | 50% | 348-842 | 41% | 143-427 | 33% | 120-151 | 79% | 5.8 | 1.1 |
| Willie Farley | 159 | 21.3 | 53% | 48% | 1236-2919 | 42% | 334-920 | 36% | 536-669 | 80% | 7.8 | 1.2 |
| John Stelzer | 252 | 6.2 | 53% | 48% | 527-1293 | 41% | 181-484 | 37% | 315-406 | 78% | 2.1 | 1.2 |
| Adam Caporn | 160 | 5.2 | 53% | 50% | 294-711 | 41% | 122-354 | 34% | 125-186 | 67% | 1.8 | 1.2 |
| Casper Ware | 156 | 18.3 | 53% | 47% | 947-2409 | 39% | 393-1230 | 32% | 569-689 | 83% | 6.1 | 1.2 |
| Tai Wesley | 167 | 10.7 | 53% | 50% | 718-1545 | 46% | 101-334 | 30% | 258-367 | 70% | 4.3 | 1.2 |
| Lamar Patterson | 134 | 16.1 | 52% | 48% | 784-1808 | 43% | 181-570 | 32% | 402-555 | 72% | 5.9 | 1.2 |
| Simon Kerle | 381 | 14.0 | 52% | 49% | 1886-4641 | 41% | 750-2098 | 36% | 817-1031 | 79% | 5.0 | 1.2 |
| Martin Mclean | 133 | 5.1 | 52% | 50% | 237-604 | 39% | 133-366 | 36% | 75-107 | 70% | 1.8 | 1.1 |
| Rodger Smith | 268 | 6.4 | 52% | 48% | 632-1432 | 44% | 101-345 | 29% | 356-486 | 73% | 2.4 | 1.2 |
| Mark Dickel | 71 | 11.3 | 52% | 47% | 248-640 | 39% | 107-313 | 34% | 199-290 | 69% | 3.5 | 1.3 |
| Scott Machado | 84 | 14.8 | 52% | 48% | 435-1074 | 41% | 153-445 | 34% | 220-265 | 83% | 5.2 | 1.2 |
| Jason Williams | 166 | 5.1 | 52% | 50% | 290-722 | 40% | 139-392 | 35% | 123-193 | 64% | 1.7 | 1.2 |
| Lachlan Armfield | 158 | 7.9 | 52% | 48% | 435-1068 | 41% | 157-426 | 37% | 217-283 | 77% | 2.8 | 1.2 |
| Liam Rush | 212 | 8.7 | 52% | 50% | 724-1614 | 45% | 170-478 | 36% | 236-373 | 63% | 3.4 | 1.1 |
| Mike McKay | 448 | 12.7 | 52% | 49% | 2183-5103 | 43% | 684-1757 | 39% | 636-807 | 79% | 4.9 | 1.1 |
| Damian Keogh | 406 | 13.7 | 52% | 49% | 2033-4828 | 42% | 625-1675 | 37% | 854-1138 | 75% | 5.0 | 1.1 |
| Luke Kendall | 173 | 10.6 | 52% | 48% | 607-1602 | 38% | 326-941 | 35% | 294-365 | 81% | 3.5 | 1.1 |
| Brendan Mann | 177 | 5.8 | 52% | 46% | 319-851 | 37% | 147-455 | 32% | 240-305 | 79% | 1.8 | 1.2 |
| Glen Saville | 563 | 12.9 | 52% | 48% | 2647-6213 | 43% | 728-1997 | 36% | 1225-1723 | 71% | 4.7 | 1.2 |
| Ray Gordon | 424 | 5.3 | 52% | 49% | 827-1955 | 42% | 253-765 | 33% | 355-511 | 69% | 2.0 | 1.2 |
| Stephen Weigh | 276 | 8.6 | 52% | 48% | 854-2082 | 41% | 278-823 | 34% | 398-495 | 80% | 3.1 | 1.1 |
| Jarrod Kenny | 207 | 3.9 | 52% | 51% | 292-730 | 40% | 154-409 | 38% | 65-105 | 62% | 1.4 | 1.1 |
| Milton Doyle | 131 | 15.9 | 52% | 48% | 750-1851 | 41% | 276-850 | 32% | 305-365 | 84% | 5.7 | 1.1 |
| Alan Black | 245 | 11.3 | 52% | 49% | 1194-2528 | 47% | 106-232 | 46% | 280-354 | 79% | 4.9 | 1.1 |
| Matthew Shanahan | 395 | 6.8 | 52% | 48% | 935-2367 | 40% | 420-1172 | 36% | 387-510 | 76% | 2.4 | 1.1 |
| Brian Wethers | 55 | 22.4 | 52% | 49% | 480-1094 | 44% | 113-352 | 32% | 157-224 | 70% | 8.7 | 1.1 |
| Tony Ronaldson | 665 | 15.3 | 52% | 48% | 3738-8903 | 42% | 1145-3347 | 34% | 1512-2146 | 70% | 5.6 | 1.1 |
| Gary Ervin | 112 | 16.7 | 51% | 46% | 657-1591 | 41% | 158-481 | 33% | 400-525 | 76% | 5.9 | 1.2 |
| Shawn Dennis | 197 | 5.9 | 51% | 50% | 433-1062 | 41% | 188-487 | 39% | 99-137 | 72% | 2.2 | 1.1 |
| Justin Cass | 153 | 7.2 | 51% | 49% | 443-1012 | 44% | 107-296 | 36% | 113-147 | 77% | 2.9 | 1.1 |
| Mirko Djeric | 170 | 5.0 | 51% | 49% | 280-783 | 36% | 205-608 | 34% | 90-113 | 80% | 1.6 | 1.1 |
| Corey Webster | 286 | 11.1 | 51% | 49% | 1200-2921 | 41% | 446-1243 | 36% | 339-428 | 79% | 4.2 | 1.1 |
| Jordon Crawford | 65 | 16.1 | 51% | 48% | 377-940 | 40% | 144-402 | 36% | 146-181 | 81% | 5.8 | 1.1 |
| Michael Hill | 235 | 9.2 | 51% | 46% | 717-1797 | 40% | 217-659 | 33% | 519-733 | 71% | 3.1 | 1.2 |
| Wayne Carroll | 283 | 13.3 | 51% | 49% | 1588-3453 | 46% | 189-483 | 39% | 399-522 | 76% | 5.6 | 1.1 |
| Wayne Burden | 167 | 14.7 | 51% | 49% | 1011-2183 | 46% | 104-304 | 34% | 326-492 | 66% | 6.1 | 1.1 |
| Mark Gaze | 182 | 9.7 | 51% | 49% | 701-1651 | 42% | 212-507 | 42% | 160-198 | 81% | 3.9 | 1.1 |
| Darren Perry | 252 | 8.8 | 51% | 48% | 760-1983 | 38% | 375-1061 | 35% | 329-449 | 73% | 3.0 | 1.1 |
| Kyle Adnam | 263 | 6.7 | 51% | 45% | 591-1541 | 38% | 214-655 | 33% | 364-424 | 86% | 2.2 | 1.1 |
| Aaron Trahair | 422 | 12.4 | 51% | 47% | 1733-4631 | 37% | 878-2529 | 35% | 876-1121 | 78% | 4.1 | 1.1 |
| Matthew Dellavedova | 121 | 10.5 | 51% | 48% | 476-1148 | 41% | 147-450 | 33% | 172-227 | 76% | 3.9 | 1.1 |
| Nathan Herbert | 120 | 5.7 | 51% | 49% | 259-640 | 40% | 104-317 | 33% | 66-82 | 80% | 2.2 | 1.1 |
| Rod Johnson | 367 | 10.6 | 51% | 48% | 1478-3542 | 42% | 465-1338 | 35% | 459-619 | 74% | 4.0 | 1.1 |
| Reuben Te Rangi | 391 | 5.1 | 51% | 48% | 716-1781 | 40% | 291-907 | 32% | 273-423 | 65% | 1.8 | 1.1 |
| Damien Ryan | 147 | 11.4 | 51% | 48% | 613-1516 | 40% | 221-634 | 35% | 228-309 | 74% | 4.2 | 1.1 |
| Peter Harvey | 196 | 5.2 | 51% | 46% | 337-880 | 38% | 132-422 | 31% | 214-288 | 74% | 1.7 | 1.2 |
| Trevor Torrance | 305 | 9.3 | 51% | 48% | 1123-2597 | 43% | 237-621 | 38% | 353-467 | 76% | 3.7 | 1.1 |
| Ian Davies | 252 | 17.8 | 51% | 48% | 1801-4184 | 43% | 452-1216 | 37% | 431-580 | 74% | 7.1 | 1.1 |
| Eric Bailey | 136 | 16.7 | 50% | 48% | 934-2090 | 45% | 128-335 | 38% | 275-365 | 75% | 6.9 | 1.1 |
| Luke Martin | 289 | 5.4 | 50% | 47% | 550-1374 | 40% | 195-583 | 33% | 262-387 | 68% | 1.9 | 1.1 |
| Mark Dalton | 421 | 9.4 | 50% | 47% | 1534-3436 | 45% | 136-479 | 28% | 746-1108 | 67% | 3.6 | 1.1 |
| Izayah Le'Afa | 166 | 6.9 | 50% | 48% | 390-1073 | 36% | 242-745 | 32% | 128-162 | 79% | 2.3 | 1.1 |
| Kevin White | 299 | 2.8 | 50% | 48% | 294-783 | 38% | 167-528 | 32% | 80-112 | 71% | 1.0 | 1.1 |
| Greg Blake | 165 | 4.5 | 50% | 48% | 269-710 | 38% | 145-407 | 36% | 63-78 | 81% | 1.6 | 1.1 |
| Peter Wain | 198 | 12.3 | 50% | 47% | 986-2269 | 43% | 160-398 | 40% | 309-384 | 80% | 5.0 | 1.1 |
| Daniel Joyce | 131 | 4.7 | 50% | 45% | 171-498 | 34% | 105-334 | 31% | 166-261 | 64% | 1.3 | 1.2 |
| Cameron Tovey | 245 | 5.6 | 50% | 47% | 504-1179 | 43% | 105-344 | 31% | 256-441 | 58% | 2.1 | 1.2 |
| Ben Thompson | 267 | 7.3 | 50% | 48% | 738-1843 | 40% | 286-794 | 36% | 179-245 | 73% | 2.8 | 1.1 |
| Drew Williamson | 190 | 4.9 | 50% | 46% | 304-853 | 36% | 176-543 | 32% | 144-182 | 79% | 1.6 | 1.1 |
| Aaron Bruce | 90 | 9.7 | 49% | 44% | 294-791 | 37% | 105-318 | 33% | 181-219 | 83% | 3.3 | 1.1 |
| Michael Cedar | 219 | 7.3 | 49% | 47% | 560-1528 | 37% | 308-924 | 33% | 161-214 | 75% | 2.6 | 1.0 |
| Rupert Sapwell | 359 | 6.4 | 49% | 47% | 893-2087 | 43% | 166-535 | 31% | 346-595 | 58% | 2.5 | 1.1 |
| Graham Kubank | 173 | 8.4 | 49% | 47% | 572-1423 | 40% | 196-534 | 37% | 113-163 | 69% | 3.3 | 1.0 |
| Brendan Joyce | 289 | 8.2 | 48% | 46% | 920-2225 | 41% | 218-616 | 35% | 298-489 | 61% | 3.2 | 1.1 |
| Tom Greer | 227 | 4.0 | 48% | 45% | 339-867 | 39% | 107-346 | 31% | 122-177 | 69% | 1.5 | 1.0 |
| Shaun Bruce | 375 | 4.3 | 48% | 44% | 555-1533 | 36% | 251-838 | 30% | 234-295 | 79% | 1.5 | 1.0 |