

NBL25: Salary Spend Revealed for Every Team
ESPN has compiled detailed salary and spending data for the 2024–25 NBL season, giving fans and analysts a unique look at how teams managed their budgets on the road to a championship.
While some clubs leaned into the NBL’s flexible salary rules and pushed their spending past the cap in pursuit of success, others stayed conservative — with three franchises failing to even hit the league’s salary floor.
Understanding the System
The NBL operates under a soft salary cap system. Each team is allocated a cap ceiling — $1,947,662.58 for the 2024–25 season — but can legally spend beyond it if they pay a luxury tax.
To support parity, that tax is redistributed to under-cap teams. Clubs can also nominate players as marquees to reduce their cap hit, while the Special Restricted Player and Indigenous Player exemptions allow certain salaries to be partially or fully exempt from the cap.
While cap spend determines tax implications, cash spend reflects what clubs actually paid out — including:
-
Real AUD-to-USD exchange rates (not NBL’s fixed rate)
-
Agent fees and non-cap-exempt bonuses
-
Estimated values for Next Stars (a uniform $100K added for each)
For a full breakdown of salary cap criteria, check out the Aussie Hoopla Free Agent Tracker.
League-Wide Spending Snapshot
Spending data — confirmed by multiple sources — shows that while Perth led the league in total cash outlay, Melbourne United topped the list for cap spend, incurring the biggest tax bill of the season.
At the other end of the scale, Cairns, Brisbane, and New Zealand fell below the league’s salary floor — spending well under the cap across the board.
2024–25 NBL Team Spending
Salary Cap Spend Rankings
| Rank | Team | Cap Spend |
|---|---|---|
| 1 | Melbourne United | $2,432,559 |
| 2 | Adelaide 36ers | $2,405,637 |
| 3 | Perth Wildcats | $2,336,654 |
| 4 | SEM Phoenix | $2,082,954 |
| 5 | Tasmania JackJumpers | $2,020,381 |
| 6 | Sydney Kings | $1,981,497 |
| 7 | Illawarra Hawks | $1,800,105 |
| 8 | NZ Breakers | $1,688,690 |
| 9 | Brisbane Bullets | $1,646,272 |
| 10 | Cairns Taipans | $1,621,233 |
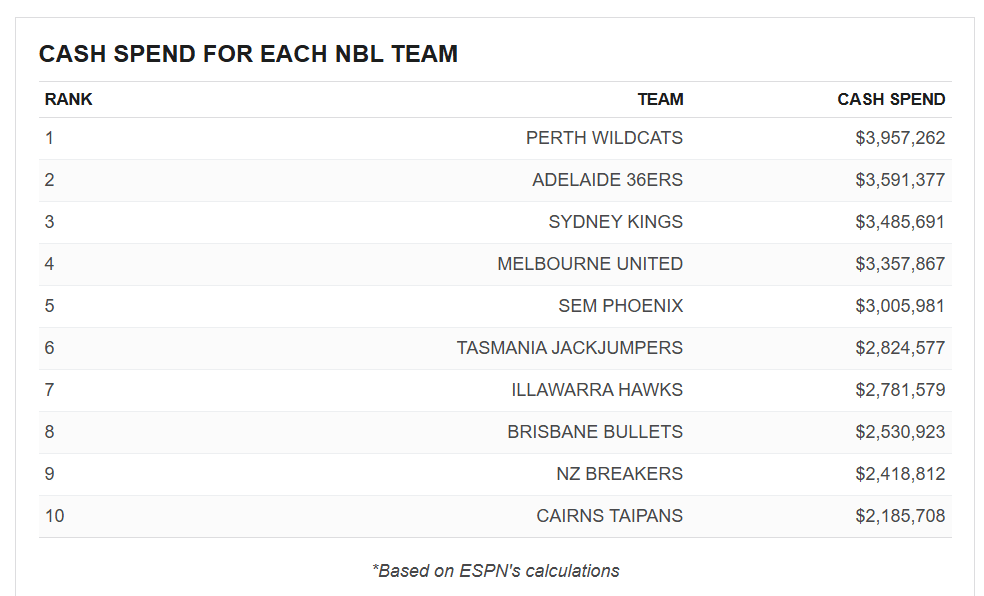
Total Cash Spend Rankings
| Rank | Team | Cash Spend |
|---|---|---|
| 1 | Perth Wildcats | $3,957,262 |
| 2 | Adelaide 36ers | $3,591,377 |
| 3 | Sydney Kings | $3,485,691 |
| 4 | Melbourne United | $3,357,867 |
| 5 | SEM Phoenix | $3,005,981 |
| 6 | Tasmania JackJumpers | $2,824,577 |
| 7 | Illawarra Hawks | $2,781,579 |
| 8 | Brisbane Bullets | $2,530,923 |
| 9 | NZ Breakers | $2,418,812 |
| 10 | Cairns Taipans | $2,185,708 |
Quick Takeaways
-
The Illawarra Hawks won the title while staying 7.6% under the cap. Smart use of league exemptions (Special Restricted + Indigenous Player Rules) and timing of player contracts kept their costs low.
-
Perth Wildcats nearly hit $4 million in cash spend, led by MVP Bryce Cotton and other big contracts — even with injury-related savings.
-
Melbourne United had the highest cap spend due to minimal injuries and multiple marquee designations.
- SEM Phoenix: Just above the cap, but under $3.1M in real spend for a full-strength roster.
-
Brisbane, NZ, and Cairns all fell short of the salary floor, largely due to injury tolls and cautious spending.
-
Total league-wide luxury tax paid was over $500,000, with Melbourne, Adelaide, and Perth contributing the most.