

Over the past three NBL seasons, clubs have spent almost $97 million assembling their rosters, but how much of that money has translated into wins, and which teams have delivered the best value for money?
These figures represent cash spend, not salary cap spend. Cash spending includes player salaries and additional costs such as agent fees, bonuses, import related expenses and luxury tax, rather than simply the amounts counted against the league’s salary cap.
How much have NBL teams spent over the past three seasons?
| Team | 2023/24 | 2024/25 | 2025/26 | Total cash spend |
|---|---|---|---|---|
| Perth Wildcats | $3,653,800 | $3,957,262 | $4,832,179 | $12,443,241 |
| Adelaide 36ers | $3,285,900 | $3,591,377 | $4,667,973 | $11,545,250 |
| Sydney Kings | $2,975,400 | $3,485,691 | $4,826,342 | $11,287,433 |
| Melbourne United | $3,160,800 | $3,357,867 | $3,818,079 | $10,336,746 |
| Tasmania JackJumpers | $3,267,000 | $2,824,577 | $3,254,777 | $9,346,354 |
| Illawarra Hawks | $2,910,100 | $2,781,579 | $3,094,633 | $8,786,312 |
| South East Melbourne Phoenix | $2,792,300 | $3,005,981 | $2,973,039 | $8,771,320 |
| Brisbane Bullets | $2,805,600 | $2,530,923 | $3,024,466 | $8,360,989 |
| New Zealand Breakers | $2,957,700 | $2,418,812 | $2,823,307 | $8,199,819 |
| Cairns Taipans | $2,094,500 | $2,185,708 | $3,370,782 | $7,650,990 |
| League total | $29,903,100 | $30,139,777 | $36,685,577 | $96,728,454 |
Takeways
- Perth has spent the most over the three seasons, committing $12.44 million to its playing rosters.
- That’s almost $4.8 million above Cairns (38.5% more spend).
- Adelaide ranks second at $11.55 million
- Sydney comes in third at $11.29 million.
Perth, the league’s highest cash spender, hasn’t won a championship during that period.
In fact, not one of the three championships was won by the team that spent the most money, and the highest spending team didn’t even reach the Grand Final in any of those seasons.
Perth was eliminated by Tasmania in the 2024 semifinals, Melbourne United in the 2025 semifinals and Sydney in the 2026 semifinals.
The eventual champions tell a different story. Tasmania claimed the 2024 title while ranking third in cash spending. Illawarra won the 2025 championship despite ranking seventh.
How many games did each team win?
The following table breaks down every club’s regular season victories over the three seasons, making it easier to identify which teams consistently converted their financial investment into on court success.
| Team | 2023/24 wins | 2024/25 wins | 2025/26 wins | Total wins |
|---|---|---|---|---|
| Melbourne United | 20 | 19 | 20 | 59 |
| Perth Wildcats | 17 | 18 | 21 | 56 |
| Sydney Kings | 13 | 16 | 24 | 53 |
| Adelaide 36ers | 12 | 13 | 23 | 48 |
| South East Melbourne Phoenix | 10 | 16 | 22 | 48 |
| Illawarra Hawks | 14 | 20 | 13 | 47 |
| Tasmania JackJumpers | 16 | 13 | 14 | 43 |
| New Zealand Breakers | 13 | 10 | 13 | 36 |
| Brisbane Bullets | 13 | 12 | 6 | 31 |
| Cairns Taipans | 12 | 8 | 9 | 29 |
| League total | 140 | 145 | 165 | 450 |
Regular season wins only.
Melbourne United has been the most consistent regular season performer, winning 20, 19 and 20 games across the three campaigns.
Sydney and Adelaide recorded substantial improvements in 2025/26, while Brisbane and Cairns struggled to turn their investment into victories.
Across the three individual seasons, there was a positive relationship between cash spending and regular season wins. The correlation coefficients increased from approximately 0.54 in 2023/24 to 0.64 in 2024/25 and 0.70 in 2025/26.
This suggests that higher spending teams generally enjoy an advantage, although the relationship is far from absolute. With only 10 clubs per season, those figures should not be interpreted as proof that spending more directly causes teams to win more games.
Andrew Bogut’s reminder: championships don’t always go to the biggest spenders
Following Sydney’s 2022 championship, Kings part owner Andrew Bogut took aim at claims that the club had simply purchased its title.
Today our part-owner Andrew Bogut shared a special message to all our members via email.
While declaring them all champions he revealed the Kings were actually seventh in total player spend for #NBL22
Bogut’s message here: https://t.co/wThxddtg3l
#WeTheKings | @andrewbogut https://t.co/yYQM5dqqXu— Sydney Kings (@SydneyKings) June 6, 2022
In an open letter to club members, Bogut revealed Sydney’s salary cap expenditure that season was $1,501,592.63, which he said ranked seventh in the competition.
His emphasis was unmistakable:
“Yes, SEVENTH.”
Read Andrew Bogut’s original letter to Sydney Kings members.
NBL spending has grown by almost 23%
Across the league, team spends have increased from $29.90 million in 2023/24 to $36.69 million in 2025/26.
That’s an increase of 22.7% in just two seasons.
Part of that increase reflects the longer regular season schedule. NBL clubs played 28 regular season games in 2023/24, 29 in 2024/25 and 33 in 2025/26.
When adjusted for the number of scheduled games, average league spending per team game rose by approximately 4.1% between 2023/24 and 2025/26.
The figures nevertheless highlight the substantial investment required to compete in today’s NBL, particularly when clubs commit significant money to established stars, marquee players and injury replacements.
How much does a win cost?
Melbourne United has seen the greatest return on their dollar, spending $10,336,746 for a total 59 regular season wins ($175,199 per victory).
| Rank | Team | Total cash spend | Total wins | Spend per win |
|---|---|---|---|---|
| 1 | Melbourne United | $10,336,746 | 59 | $175,199 |
| 2 | South East Melbourne Phoenix | $8,771,320 | 48 | $182,736 |
| 3 | Illawarra Hawks | $8,786,312 | 47 | $186,943 |
| 4 | Sydney Kings | $11,287,433 | 53 | $212,970 |
| 5 | Tasmania JackJumpers | $9,346,354 | 43 | $217,357 |
| 6 | Perth Wildcats | $12,443,241 | 56 | $222,201 |
| 7 | New Zealand Breakers | $8,199,819 | 36 | $227,773 |
| 8 | Adelaide 36ers | $11,545,250 | 48 | $240,526 |
| 9 | Cairns Taipans | $7,650,990 | 29 | $263,827 |
| 10 | Brisbane Bullets | $8,360,989 | 31 | $269,709 |
Spend per win = total cash spend divided by total regular season wins. Finals and play in victories are excluded. Figures rounded to the nearest dollar.
Behind Melbourne, South East Melbourne and Illawarra round out the top three, demonstrating that the highest spending rosters aren’t necessarily delivering the strongest return in regular season results.
Perhaps the biggest surprise is South East Melbourne. The Phoenix have recorded the same 48 regular season wins as Adelaide while spending approximately $2.77 million less.
While Brisbane ranks last over the three year period, its 2025/26 season stands out as the poorest return on spending of any individual season examined.
The Bullets spent $3,024,466 on their roster but managed just six regular season wins from 33 games.
That equates to an extraordinary $504,078 spent for every Brisbane victory, more than half a million dollars per win.
For comparison, South East Melbourne spent $2,973,039 during the same season and won 22 games, bringing its spending per victory down to just $135,138.
Brisbane therefore spent approximately 3.7 times as much per victory as the Phoenix, despite the two clubs having remarkably similar total cash expenditure.
The biggest single season outlay was Perth’s $4,832,179 in 2025/26. That investment produced 21 regular season victories at approximately $230,104 per win, but no Grand Final appearance.
Financial Lessons
The three seasons highlight several different approaches to roster construction, and some expensive lessons.
Perth Wildcats: spending the most doesn’t guarantee a title.
Perth has consistently invested more than any other club, but its 2025/26 season illustrates how quickly spending can escalate when recruitment doesn’t work.
Its decision to release import Mason Jones, while reportedly still paying a substantial part of his contract, contributed to the club’s record $4.83 million cash spend. The Wildcats finished fourth with 21 regular season wins before exiting during the finals.
Illawarra Hawks: roster construction can beat purchasing power.
The Hawks’ 2025 championship is the clearest case study. They spent $2.78 million, seventh most in the league, yet finished first with 20 regular season wins before defeating Melbourne United in the Championship Series.
Illawarra benefited from contracts signed before Sam Froling and Lachlan Olbrich had fully established their market value, while the club also received salary cap exemptions for Hyunjung Lee and Will Hickey.
Their ability to take advantage of this and win the title without paying luxury tax make a huge financial difference.
South East Melbourne Phoenix: the value of spending intelligently.
In 2025/26, the Phoenix spent just $2.97 million, ranking ninth in cash spending, yet finished third with 22 regular season wins and reached a deciding semifinal against Adelaide.
That equates to approximately $135,138 per regular season win for that season alone.
Every other NBL team reportedly had at least one player earning more than South East Melbourne’s highest paid player, yet the Phoenix consistently competed with more expensive rosters.
Sydney Kings: big spending can still pay off.
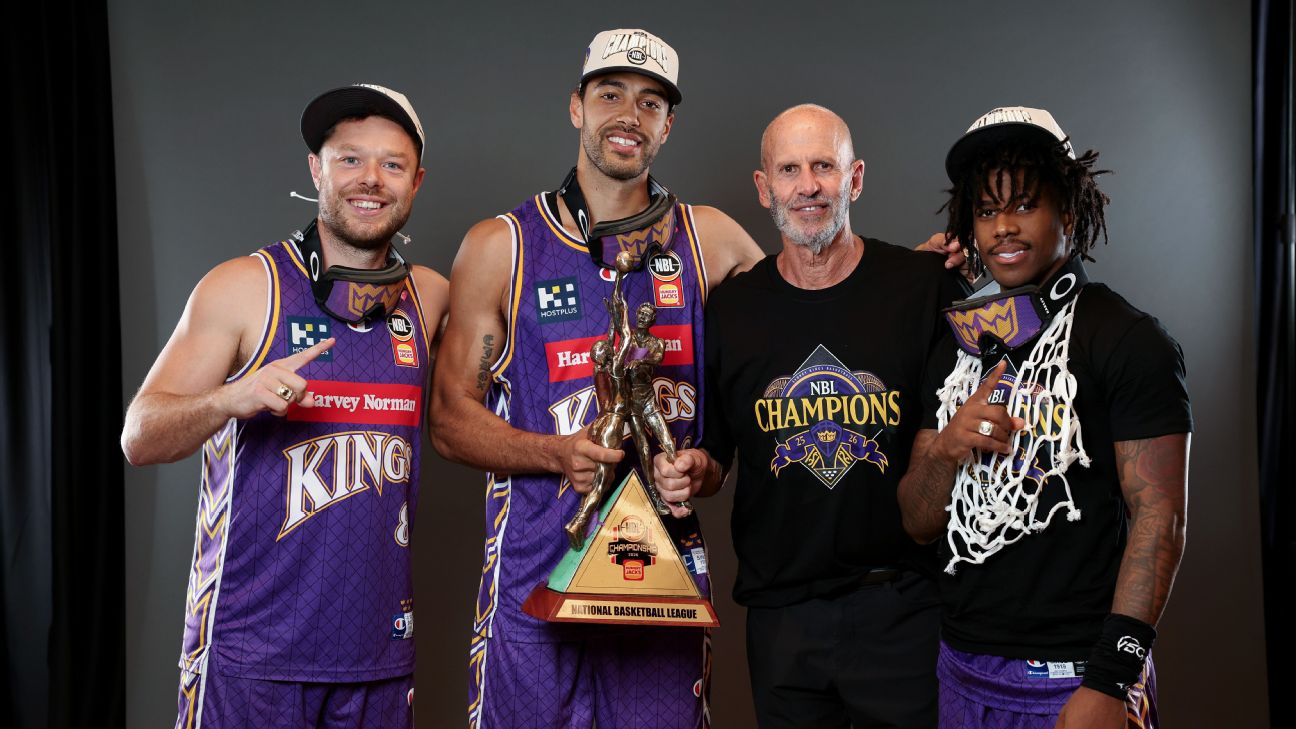
Sydney spent $4.83 million in 2025/26, second only to Perth, and won the championship.
That roster featured substantial financial commitments to Xavier Cooks and Kendric Davis, along with Matthew Dellavedova and the midseason acquisition of Torrey Craig, who provided an NBA calibre talent at only half a season’s cost.
Adelaide 36ers: talent is expensive, and mistakes are expensive too.
Adelaide spent the second most money across the three seasons.
In 2023/24, the expensive recruitment and early release of Jamaal Franklin contributed to a $3.29 million outlay and just 12 wins.
Two seasons later, Adelaide reached the Championship Series after spending $4.67 million. Until Adelaide were able to take advantage of Bryce Cotton’s Australian citizenship, which reduced its cap exposure, to see their team spend make any impact on their wins tally.
Cairns Taipans: increasing the budget isn’t always enough.
Cairns lifted its cash spending from $2.19 million in 2024/25 to $3.37 million in 2025/26, including a major investment in Jack McVeigh.
Yet its regular season win total improved from eight to only nine, despite four additional scheduled games. Injuries to McVeigh (4 games), Reyne Smith (19 games) and starting big man Sam Waardenburg (25 games), played a part in that.
So, does money equal wins in the NBL?
Money helps. But money alone doesn’t win championships.
The relationship between spending and regular season results is real. Bigger budgets generally offer access to better established players, more roster depth and greater flexibility when injuries or failed imports force teams to make changes.
But spending efficiently matters just as much as spending heavily.
Across the three seasons examined, Perth spent the most money without winning a championship or reaching a Grand Final. Melbourne United produced the most regular season wins for the lowest cost per victory. South East Melbourne delivered strong results with a comparatively inexpensive roster, while Illawarra won a title as the seventh highest cash spender in its championship season.
And although Sydney proved that a high spending team can put together a championship winning roster in 2026, it still required those players to perform when the title was on the line.